CalcGen AI: Streamlined Data Visualization and Analysis
Cut text-to-speech costs with Unreal Speech. 11x cheaper than 11Labs. Production-ready. Stream in 300ms. Generate 10-hr audio. 48 voices. 8 languages. Per-word timestamps. 250K chars free. Try live demo:
0/250
Voice
Language
Format
Filesize
0 kb
CalcGen AI
Automates data visualization and analysis with customizable features.
Overview of CalcGen AI: Streamlined Data Visualization Platform
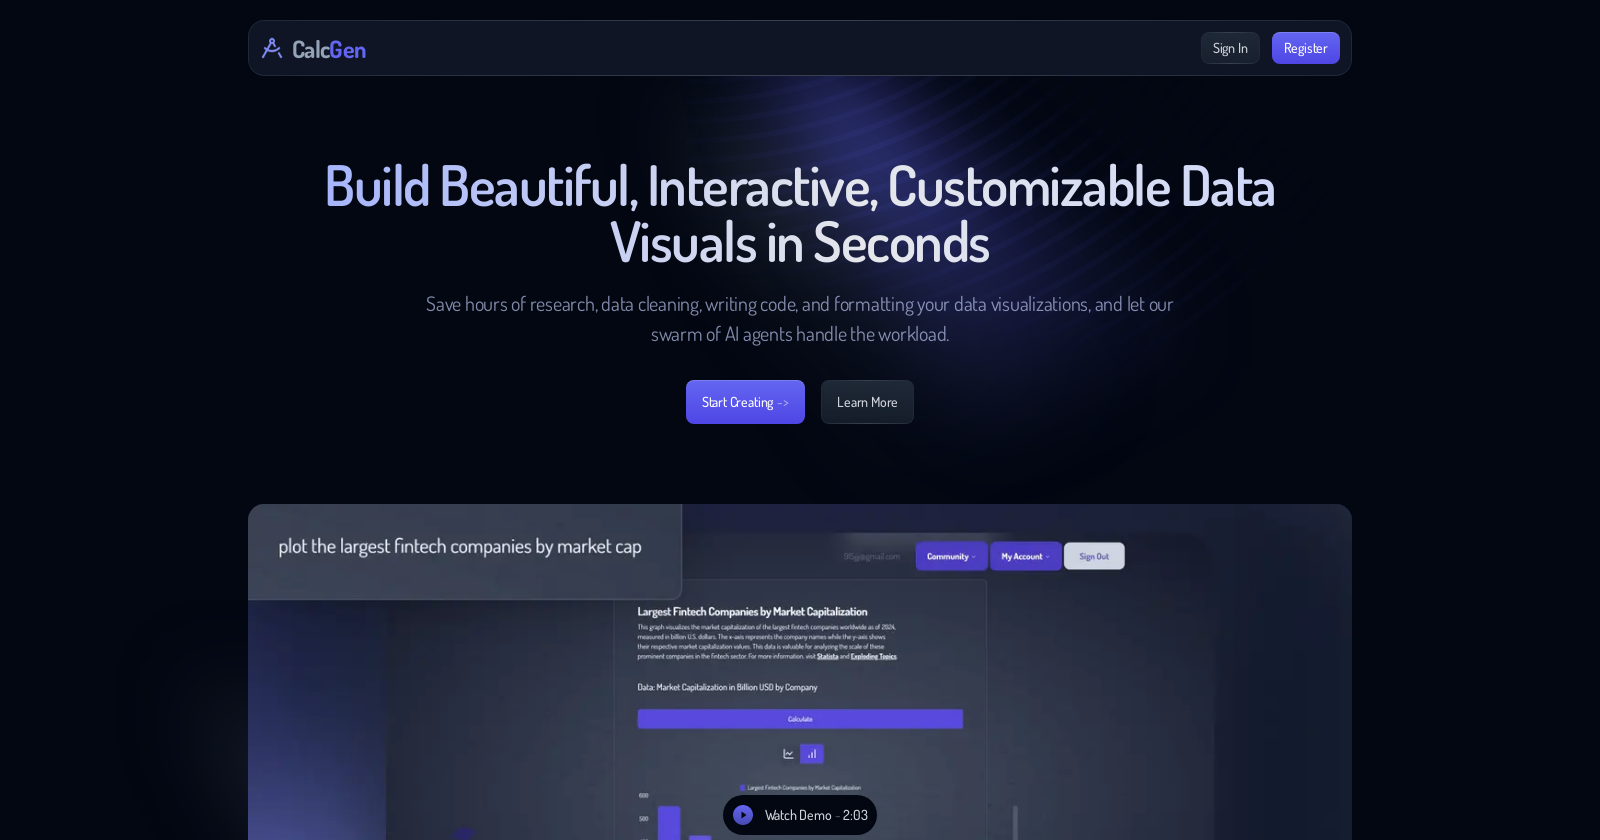
CalcGen AI is a multi-agent AI platform designed to simplify the process of creating data visualizations. It automates tasks such as research, data cleaning, analysis, and visualization, allowing users to generate comprehensive, interactive charts and graphs with minimal effort.
Key Features
Automated Research and Analysis
- Search Agent: Automatically searches the internet for relevant data, providing links to credible sources for user verification.
- Analysis Agent: Offers detailed analysis of data without the need for users to add titles or write-ups.
- Visualization Agent: Enables customization of data presentation, including filters and sorting options.
Customization and Integration
- Tailored Workflows: Users can customize visualizations to reflect their brand’s design language.
- Theme Library: Offers a variety of pre-built themes to align with different styles and branding.
- Easy Editing: Provides control over the visualization’s title, description, and linked sources.
- Integration Options: Supports embedding into various platforms like Notion, PowerPoint, WordPress, Wix, and Miro.
User Interface and Support
- Intuitive Interface: Simplifies the creation process; users describe their data needs and the platform’s agents handle the rest.
- Full Support: Includes a comprehensive library of tutorials, tips, and guides. Email support is available for additional help.
User Feedback and Recognition
- Positive Reviews: Users have praised CalcGen AI for its efficiency and ease of use, noting significant time savings in data handling and visualization.
- Media Features: Recognized by notable publications and platforms such as Superpower Daily, Rundown AI, and Product Hunt for its utility and performance.
Pricing
- Subscription Plans: Starting at $9.99, offering various features based on the subscription level chosen.
CalcGen AI is positioned as a helpful tool for professionals across various industries, aiming to enhance productivity by automating the labor-intensive parts of data visualization.
Related Apps
Featured
SoBrief – Book Summaries
Read any book in 10 minutes. 100% free to read. Audio in 40 languages.
Text to Speech
Amazon Polly
Converts text into lifelike speech with customizable, natural-sounding voices.
Photo Editing
Remove.bg
Automatic background removal from images with quick, high-quality results.
Video Editing
CapCut Online Creative Suite
Comprehensive suite for video editing, graphic design, and collaboration.
Video Production
AI Studios
Transforms text into engaging videos with diverse avatars and editing.
Website Creation
Mixo
Automates website creation and growth with no coding required.
UI Design
Uizard
Simplifies UI design with automated features and collaborative tools.
Academic Writing
Academic Help
Comprehensive writing assistance with plagiarism check and educational resources.
Academic Research
Scispace
Enhances research with interactive PDFs, summaries, and question-answering tools.
eLearning Creation
Coursebox
Online course creation and distribution tool with interactive features.
WordPress Development
CodeWP
WordPress development tool with code generation and troubleshooting features.
Photo Editing
Cleanup.pictures
Web-based photo editing tool for object removal and image enhancement.
Video Editing
Opus Clip
Transforms long videos into engaging, shareable short clips.
Content Creation
Easy-Peasy.AI
Comprehensive digital content creation and optimization tools suite.
Presentation Software
Decktopus AI
Automates presentation creation with customizable designs and content generation.
Video Editing
Vidyo
Streamlines video editing for social media content creation.
AI Tools
PresentationsAI
Automates efficient, professional presentation creation and design.
Digital Art
SeaArt
Digital art creation and exploration with extensive models and community.
Text Summarization
TLDR This
Summarizes long texts into concise, key paragraph summaries.
Writing Assistance
Paraphraser
Enhances writing with paraphrasing, plagiarism checks, and content generation.
Educational Technology
ClassPoint AI
Generates interactive quizzes from presentation content for educational engagement.
Educational Technology
AI Course Creator
Automates creation and customization of educational mini-courses.
Video Summarization
AI YouTube Summarizer
Summarizes YouTube videos instantly using artificial intelligence.
Video Marketing
Vidon
Automates video creation and sharing for marketing and engagement.
Data Analysis
Vizly
Simplifies data analysis and visualization through conversational interaction.
Architectural Design
Makeit.ai
Automates residential architectural planning and design compliance.
Online Education
LearningStudioAI
Transformative tool for creating engaging online courses.
Mind Mapping
Chatmind
Online tool for creating, refining, and presenting mind maps.
Video Creation
VideoGen
Rapid video creation tool with extensive assets and text-to-speech.
Marketing Strategy
FounderPal
Generates personalized marketing strategies for individual entrepreneurs.
Video Editing
Latte
Video editing tool for creating engaging social media content.